Designation of mountains on a contour map. Conventional signs of topographic maps
To meet the requirement of visibility of topographic materials and understanding the content of plans and maps, a special system of graphic designation of terrain objects, which is called conventional signs, has been developed. Conventional signs subdivided into areal, linear, off-scale, explanatory and special.
Areal (contour or scale) signs are used to fill in the contours of natural and agricultural lands, the length and width of which is expressed on the scale of the map. The boundaries of the contours are shown with a dotted line, inside which a conventional sign is depicted, resembling an object in a given area. For example, a forest is represented by circles, sands by dots, etc.
Linear and conventional signs show objects of a linear nature (roads, rivers, power lines, etc.), the length of which is expressed, but the width is not expressed on the scale of the map. Linear signs have various numerical characteristics that complement the information about the subject. For example, a highway shows the width of the carriageway and the total width of the road.
Out-of-scale conventional signs serve to depict objects whose dimensions are not expressed on the map scale (bridges, wells, kilometer posts, etc.).
Explanatory symbols are signatures that give the characteristics and names of objects, for example, the length and width of bridges, the type of forest plantations, etc. These signs are affixed to the main areal, linear and off-scale symbols.
Special symbols are used by the relevant departments when compiling special maps and plans for this industry, for example, communication pipelines (heating mains, water supply, etc.).
In addition to conventional signs, for greater clarity, the image of various elements topographic maps use color:
For rivers, lakes, canals, wetlands - blue;
For forests and gardens - green;
Highways - red;
Railroads and the rest of the situation is black;
The contours characterizing the terrain are shown in brown.
In addition to colors, the type of font, the thickness of the letters, their height and inclination in the designation are also used. Conventional signs for different scales are summarized in special collections published by geodesy and cartography services. They are obligatory for all departments and organizations involved in drawing up plans, maps, and topographic surveys of the area.
Knowledge of conventional signs is necessary in order to understand the content of topographic materials, to be able to “read” them and to obtain the necessary information. For a better acquaintance with conventional signs on educational topographic maps, their main samples are given.
3.6 Terrain relief and its representation on plans and maps.
Contours and their properties. Ways to build contour lines
by marks of points
relief called a set of irregularities earth's surface. Knowledge of the terrain is necessary in the design and construction of railways and roads, drainage and irrigation systems, industrial enterprises, etc. There are several ways to depict the relief on topographic maps and plans. Most old way- this is an image of the relief of the strokes, applied to the map on a special scale. The relief of the area can also be depicted under the signatures and marks of a number of dots or washes in paint and different tones. However, it turned out to be the best way to depict the relief of the horizon - l and in combination with some conventional signs and signatures of marks of characteristic points. A horizontal line is a line connecting points on the earth's surface with the same height.
To correctly depict the relief, you need to know its basic forms. There are five main landforms (figure 3.5):
Elevation (Figure 3.5, a);
Basin (Figure 3.5, b);
Ridge (Figure 3.5, c);
Hollow (Figure 3.5, d);
Saddle (Figure 3.5, e).
Figure 3.5 shows these landforms in section. Consider the essence of the image of the relief by contour lines. Figure 3.5, a shows a hill (hill, mountain), the highest point of which is called the top, the bottom - the sole, and side surfaces- slopes. To depict a hill with horizontal lines, let us imagine that this hill is crossed by a series of equally spaced planes parallel to the main level surface. The lines of intersection of these planes of the earth's surface will be contour lines. Projecting them with sheer lines onto a plane, we get an image of a hill on it.
For clarity, some horizontal lines are signed, in addition, they put berghash lines showing the direction of the slope of the area.
The distance between two adjacent cutting planes is called the height of the relief section h. On maps and plans, the height of the relief section is characterized by the difference in the heights of two adjacent horizontals. For example, in Figure 3.5, and the height of the relief section is h = 5 m.
The distance between contour lines on a plan or map is called the laying. In Figure 3.5, a laying d = AC. The relationship between the height of the relief section h, the laying d, the angle of inclination υ, the slope i and the terrain line AB can be obtained from the triangle ABC (Figure 3.5, a):
i = h / d = tg υ. (3.6)
The slope and angle of the terrain line are the main characteristics of the steepness of the slopes. The greater the angle of inclination, the steeper the slope of the terrain. From formula (3.6) it follows that the smaller the laying d or the more horizontals on the plan, the steeper the slope of the terrain.
The contour lines of the basin, hollow, ridge and saddle are shown in Figure 3.5. Hollow (depression) - a closed depression of the surface (see Figure 3.5, b). The lowest part of the depression is called the bottom, the side surfaces are called the slopes, and the line of confluence with the surrounding area is called the edge.
|
|
|
|
|
|
|
|
|
 b)
b) in)
in) G)
G)
Figure 3.5 - Basic landforms
Ridge - a hill elongated in one direction with two slopes (see Figure 3.5, c). The line of meeting of the slopes in the upper part is called the watershed (watershed line).
Hollow - a depression elongated in one direction with two slopes (Figure 3.5 d). The line of meeting of the slopes in their lower part is called the weir or thalweg (weir line).
Saddle - a depression between two hills (see Figure 3.5 e). The lowest point between the hills is called the pass.
Bergstrokes on maps and plans are usually shown along watershed and spillway lines. Signatures on horizontal lines make the base of the number show the direction of the slope. Horizontals are drawn in brown. Every tenth or fifth of them is drawn with a thickened line.
Their properties follow from the essence of contour lines:
The horizontal is a closed curved line, all points on which have the same height, a multiple of the height of the relief section;
Horizontals on the plan cannot fork and break off; if the horizontal does not close within the plan, it closes beyond its limit;
Horizontals should not intersect with each other, since they are obtained by crossing the earth's surface with planes lying at different heights;
The more often the horizontals on the plan, the greater the slope of the terrain, or the smaller the laying, the steeper the slope;
Watershed and spillway lines and directions of maximum horizontal slope cross at right angles.
The height of the relief section is set depending on the scale of the plan and the nature of the terrain so that the contours do not merge with each other. In the Republic of Belarus, the following heights of the relief section are accepted at the survey scale:
|
1:500 - h = 0.25; 0.5 m; 1:1000 - h = 0.25; 0.5; 1m; 1:2000 - h = 0.5; one; 2 m; |
1:5000 - h = 0.5; one; 2; 5 m; 1:10000 - h = 1; 2.5; 5 m |
For a more complete image and ease of reading the relief on maps and plans, marks of characteristic points of the relief (tops of hills, the bottom of basins, passes, etc.) are signed. For example, in Figure 3.5, b, the mark of the bottom of the basin is 98.7 m.
Methods for constructing contour lines by point marks. To draw contour lines on the plan, you need to plot characteristic points taken on the ground and write out their heights. Those points between which the earth's surface has no fractures, i.e., has a constant slope, connect with lines. Further, on each line, by interpolation, the points of intersection of its contour lines are found and the heights of these contour lines are noted. Having then connected points with the same heights with smooth curved lines, an image of the terrain on the plan is obtained. Thus, the task of constructing contour lines on a plan basically boils down to the ability to find projections of the points of intersection of lines by contour lines, the marks of the ends of which are known, while the height of the relief section must already be established. This task is called the interpolation of contour lines, i.e., finding intermediate values for the heights of contour lines using point marks. Interpolation can be done analytically or graphically.
analytical way. By famous heights points A and B and the distance d between them (Figure 3.6, a) it is necessary to find the distances d 1 and d 2 from point A to points M 0 and N 0 with marks H m and H N equal to the marks of contour lines.

Figure 3.6 - Analytical method of interpolation
From the similarity of triangles ABB O, AMM O and ANN O we find:
d 1 \u003d dh 1 / h; d 2 \u003d dh 2 / h,
where h \u003d H B - H A; h 1 \u003d H M - H A; h 2 \u003d H N - H A.
On the plan, the segments d 1 and d 2 are laid aside and the points M O and N O are obtained, at which their marks are signed. It should be noted that contour lines are interpolated only along lines with a uniform slope. Figure 3.6, b shows the case of incorrect interpolation between points A and C with an uneven slope of the terrain. As can be seen from the figure, instead of the actual position of point B, point B " will be obtained and, accordingly, instead of H B, the wrong height H B " will be obtained.
Graphic way. Interpolation in this way is performed using graph paper or transparent paper. If there is millimeter paper, it is applied to the plan line AB. According to the marks of the ends AB, a profile of this line is built. Projecting then on the plan line of the point of change  sections of the profile line with graph paper lines taken as secant planes receive the desired points M and N. If transparent paper (wax, tracing paper) is available, a number of parallel lines equidistant from each other are preliminarily applied to it, which are given marks of secant planes. The wax is applied to the plan so that the end points of the plan line take a position corresponding to their marks between the wax lines (Figure 3.7). Further, the points of intersection of the plan line with the lines of waxing are pierced onto the plan. These will be the desired points on the plan.
on a topographic map.
You fell into the hands of a map little known to anyone from the secret archives of a district or region. And there, long-disappeared farms, and villages, and villages, and many more incomprehensible signs, dashes and dots. What do the icons on a topographic map mean? How to understand and determine where is the current settlement, where is the disappeared one, where is the cemetery, and where is the living spring with crystal clear drinking water, which may come in handy in a sultry summer weather during the dig. Someone will say, it was necessary to learn geography, and rightly so, but you can’t remember everything.And for us, treasure hunters and amateur archaeologists, it is important to be able to read the topographic map correctly, for correct and quick orientation on the ground. Okay, when you search for antiquities in a familiar area. And if it is a foreign area or region? Old-timers of treasure hunting are advised to conduct a search together, in a company. So perhaps you can protect yourself from attacks. local residents and government officials. You will have fun in a company of like-minded people, and if something unexpected happens, you will definitely be helped. But if not one of you knows the decoding of the designation of the icons on the topographic map, you are worthless. Running from side to side, frantically looking for excavation sites around the area is stupid, defiant, excessive fuss attracts negative attention.
And so, let's proceed to a detailed study of the symbols on your secret treasure map.
1. Multiple buildings.
2. Destroyed buildings.
3. Single building.
4. Destroyed building.
5. Working mines.
6. Closed mines.
7. industrial enterprise(plant, factory).
8. Factory pipe.
9. Power plant.
10. Warehouse of fuels and lubricants.
11. The tower is either stone or metal.
12. Tower light construction(from the corners).
13. Television and radio towers.
14. Distribution transformer.
15. Center for television or radio broadcasting.
16. Runway for aircraft (airfield).
17. Housing forester.
18. Geodetic point.
19. Railroad.
20. Stone or brick fence (fence).
21. Spring.
22. Water well (crane).
23. Wind well.
24. Ordinary well, log house.
25. Muslim cemetery.
26. Main locations of tents and yurts.
27. Electric wires on wooden poles.
28. Electrical wires on concrete poles.
29. Engines powered by wind (power plants).
30. Windmills.
31. Large-scale peat extraction.
32. Water mill.
33. Gas station.
34. Meteorological point.
35. Chapel.
36. Church (temple, cathedral).
37. Large cemetery.
38. Small cemetery.
39. Monuments, obelisks, memorials and monuments.
40. Beekeeping apiary.
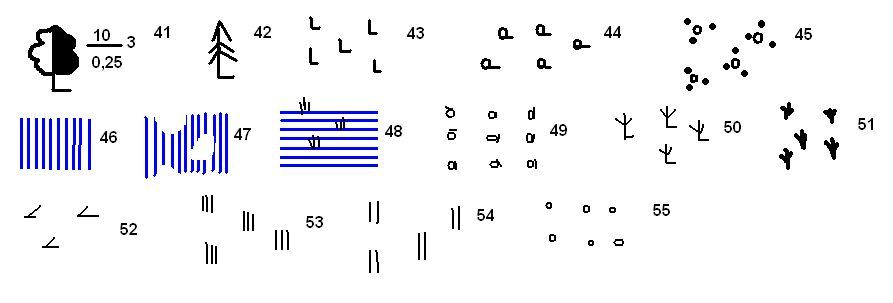
41. Forest. The numbers in the numerators - height, in the denominators - the girth of the trunk, the number next to it - the distance between the trees. Ahead of the fraction, they can write what kind of forest: birch, maple, oak, or mixed.
42. Coniferous forest.
43. Wood felled.
44. Rare forest.
45. Overgrown shrubs.
46. Salt marshes are not passable.
47. Walkable salt marshes.
48. Impenetrable swamps with vegetation. If there are three lines (as in the figure) - moss. If two dashes - grass. A bush depicts reeds or reeds.
49. Fruit garden.
50. Dry forest or burnt.
51. Reed or reed.
52. Forest felled by a storm (hurricane, tornado).
53. High herbage.
54. Meadow vegetation, less than one meter in height.
55. Young trees.

56. Ravines and pits.
57. Mounds.
58. Height is absolute.
59. Stones.
60. Cave.
61. Indication of a ford on the river. The first digit in the denominator is the depth, the second is the length. In the numerator, the first is the type of soil (T - solid), the second is the speed of the river.
62. Waste heaps.
63. Lime firing.
Cartography as a science arose in the Bronze Age. Archaeological excavations demonstrated that the oldest samples were created in Egypt, ancient Babylon, Asia Minor (modern Turkey), the Marshall Islands and Italy. Without a schematic outline of the terrain, accurate movement and the implementation of military tactics are impossible. Despite the completely different idea of the shape of the planet, the inhabitants ancient world, the Middle Ages, the Renaissance, the New Age and the present, they tried to fix all the features of the landscape as reliably as possible. Ancient people allowed many geographical inaccuracies in cartography, and the creation of schemes could be equated with art - they were performed by real masters and supplemented with many artistic elements. For example, cities were drawn in the form of castle towers with family coats of arms, forests were represented by several tree species, trading ports were indicated by the type of vessels popular in the region (Figure 1).
Figure 1. Maps used until the last century
More similar to modern samples appeared only after the 18th century, when mankind got a complete picture of the geography of the planet, the location of all rivers, seas, oceans.
However, the most accurate plans became available by the middle of the 20th century.
In everyday life, knowing what the symbols of geographical maps mean will help you quickly get to any destination. In conditions wildlife and survival, getting lost in the forest, but having a map with you, you can save your life and get out easily. Despite the popularity of GPS-navigators, electronic equipment can always let you down, incorrectly determine the coordinates or run out of power. Paper analogues are at hand and come to the rescue in any situation. They are easy to use not only to find out your location in the wild or populated areas, but also to create a shorter car route. Without the use of schemes, it is difficult to imagine the work of the military, foresters, fishermen, geological engineers and builders. What types of symbols exist on maps and how to determine them exact value, we will consider further.
Conventional signs of geographical maps
Symbols on the map are simplified graphical symbols that represent features in the landscape, such as mountain ranges, lakes, forest plantations, paths, highways, public and residential buildings borders between settlements. The icons differ depending on the type of application. For example, for urban plans they will be one, and for suburban ones they will be completely different.
 Figure 2. Main groups of characters
 The following groups of characters are distinguished (Figure 2):
- Scientific or reference. Includes soil types, landscape and soil details, fossils located in the area, types of water bodies and trees, common animals, birds and fish, buildings, municipal and socio-cultural monuments, road junctions, and more. The purpose of such schemes is a detailed display of all important features landscape for precise orientation. Also used for informational purposes;
- Educational. Designed for teaching preschool and school age. Often interactive and intuitive;
- Tourist. Without them, it is impossible to imagine the luggage of any traveler. Contain accurate landscape details. However, more attention is paid to paths in forests and mountains, crossings over rough or swampy terrain. This group also includes urban options that clearly explain new town. With their help, it is easy to visit all sightseeing places without getting lost in the interweaving of residential areas and numerous streets.
The newer the scheme, the more it corresponds to the real location of all objects. Often presented in color for easier orientation.
 Figure 3. An example of a legend for different maps
 The structure of all geographical maps - both obsolete and modern - is divided into two main parts:
- Schematically depicted landscape. The colors evoke the right associations with the real components of the terrain: forest plantations are green, bodies of water are blue or blue, hills are brown, freeways are red or orange, and railway tracks are black. Sometimes details are given, such as the material of the bridge or the type of scaffolding. However, many more signs are displayed on each plane, many of them may seem at first glance incomprehensible;
- Legend (Figure 3). A legend is an explanation for each individual scheme. There is no general standardization in cartography, but decoding of symbols and content must be present without fail, otherwise it is considered invalid. You can find the legend on free fields. Sometimes a separate place is allocated for it. Even if you have forgotten what the pictograms on the plan mean, by referring to the legend, you can intuitively figure it out.
Contrary to the prevailing stereotypes, you do not need to have specialized skills to read a geographical map, and even a schoolboy can cope with this task. Faced with a new scheme, it is enough to familiarize yourself with the legend and begin to orientate.
Types of symbols on maps
Conventional signs of geographical maps are necessary to display schematic objects on the terrain plan, their features and characteristics. They are divided into three varieties, which are determined by the scale: linear, area and point. Each of them includes objects similar in features: industrial buildings and administrative facilities (bridges, railway crossings, borders between regions and countries) or details natural landscape. Each group is identified by a simple and easy to remember icon. For example, coniferous forests represented by a schematic pine symbol (Figure 4). It reliably displays the type of object and is universal for most terrain plans, which will provide convenient and instant orientation in any conditions.
 Figure 4. Types of signs on maps
 The main requirements for icons by which you can select a suitable geographical map:
- Readability and recognizability;
- Lack of congestion of elements;
- Ease of remembering;
- Compactness and reliability.
What the symbols of topographic maps include, we will consider further.
Linear signs
Linear symbols on the map depict objects that have a certain extent (Figure 5).
Among them:
- Roads (freeways, highways, highways, paths). Divided into unpaved and asphalted. Modern and roadworthy are highlighted in orange. Gray or black represents unpaved sections of road or trail;
- Railway and tram tracks. They are divided by the number of tracks (one or several pairs of rails), width (narrow or standard), as well as general condition(working, closed and in construction mode). They are indicated by a horizontal line, on which perpendicular lines are applied in the order: one track - one line. A rectangle is drawn on the line, which indicates the station building or platform;
- Bridges. They differ depending on the material (reinforced concrete, wood, stone and others), the number of tiers, dynamics (solid, sliding or lifting). Pontoon (floating) are designated by separate symbols;
- Gas or oil pipelines;
- Power lines;
- Cellular or radio communication towers;
- Rivers of any length or streams, canals;
- Any fences or walls
- Borders between settlements and countries.
 Figure 5. An example of line signs
 Represented by colored thin, bold and bold lines (straight lines, curves). It should be noted that only their length in millimeters with translation to scale is accurate.
On the geographical maps there is no correct designation of the width of linear characters.
The exaggerated width makes it easier to read. This group also includes isolines (isohypses) necessary for the three-dimensional designation of the forms and features of the territory.
Area signs
Areal (they are also large-scale) conventional signs on the map of the area are needed to correctly convey the shape and shape, relief, size and location of large geographical objects (Figure 6). Also called "contour". These include both individual areas of the area and entire cities. They have a reliable length and width in a two-dimensional plane, presented on a reduced scale (for example, 1:10000) and shapes that are as close to reality as possible. Their structure is divided into a contour and a colored background, shading or a grid of identical symbols denoting the properties of the object.
"Plan of the area. Conventional signs»
6th grade
Today we start studying new topic"Plan of the area. Conditional signs. Knowledge of this topic will be useful to you in the future. Terrain images are of several types: drawing, photograph, aerial photograph, satellite image, map, terrain plan (topographic plan).
Use to create topographic plans modern technology(helicopters, planes, satellites) (Fig. 1).
Fig.1. Aircraft M-101T "Sokol" - designed for shooting terrain
(http://www.gisa.ru)
Photographs obtained as a result of aerial photography of the earth's surface are called aerial photographs.
Consider an aerial photograph (Fig. 2) and a topographic plan (Fig. 3) of the same area (the channel of the Moskva River in the Vorobyovy Gory area). Which image gives us more full information about geographical objects? What type of image is more convenient to use to take a walk around Moscow?
Comparison will allow us to conclude that it is precisely according to the plan of the area that we can find out detailed information about geographical objects (for example, the name of a river, the name of streets, metro stations, parks).
 Rice. 2. Aerial photo shot (http://maps.google.ru) |
 Rice. 3. Plan of the area (http://maps.google.ru) Scale 1:50 000 At
River word designations |
Imagine that you are going on a hike far from the city. You need to prepare for the conditions of an unknown area in which you have never been, you need to think about what equipment, what clothes to take, perhaps - prepare for crossing a river, ravine, etc. You can get information about the hiking area by reading the map correctly.
Before you two different images the earth's surface: a satellite image (Fig. 1) and a topographic map (land plan) (Fig. 4-5).
Let's find out comparing satellite image And terrain plan. Find similarities and differences.
Using figures 4 and 5, we will fill in the table "Features of the image of the area."
|
Image features |
Terrain plan |
aerial view |
|
1. Top view |
+ |
+ |
|
2. You can find out the name of the settlement, river, lake, etc. |
+ |
_ |
|
3. You can determine the type of vegetation, the names of tree species |
+ |
_ |
|
4. All visible objects are shown from above |
_ |
+ |
|
5. Only important objects are shown |
+ |
_ |
|
6. You can recognize the sides of the horizon |
+ |
_ |
|
7. Objects are depicted by conventional signs |
+ |
_ |
To summarize - what is a topographic map or terrain plan?
Let's write down the definition of the concept of "land plan" in a notebook.
Terrain plan or topographic plan (from lat. "planum" - plane) - an image on a plane of a small area of \u200b\u200bthe earth's surface in a reduced form using conventional signs.
In order to work with a topographic plan, you need to be able to read it. The "alphabet" of the topographic plan are conventional signs. The symbols used to build terrain plans are the same for all countries of the world, which makes them easier to use even if you don't know the language.
Conventional signs- designations used on maps or plans to depict various objects and their quantitative and qualitative characteristics. In other words, conventional signs designate objects on the plan and are similar to these objects.
What can be learned using this terrain plan (Fig. 6)?


Rice. 6. Plan of the area (T. P. Gerasimova, N. P. Neklyukova, 2009)
And much more!
Topographic symbols are usually divided into: large-scale (or areal ), off-scale , linear And explanatory .
W  Draw the following diagram in your notebook:
large-scale
, or areal
conventional signs serve to depict such topographic objects that occupy a significant area and whose dimensions in plan can be expressed in
scale given map or plan. An areal symbol consists of a boundary symbol of an object and symbols that fill it or a symbolic coloring. The outline of an object is shown as a dotted line (outline of a forest, meadow, swamp), a solid line (outline of a reservoir, settlement) or a symbol of the corresponding boundary (ditch, fence). Filling characters are located inside the contour in a certain order (arbitrarily, in a checkerboard pattern, in horizontal and vertical rows). Areal symbols allow not only to find the location of the object, but also to evaluate it linear dimensions, area and outlines ( http://www.spbtgik.ru).
W Let's draw examples of conventional signs and complete our scheme!
|
Village |
 Orchard
 Bush
Bush
 Meadow
 vyr
ubka
vyr
ubka
 L
eu deciduous
L
eu deciduous
 R
hodwheel
R
hodwheel
 ABOUT
zero
ABOUT
zero
 Garden
 arable land
 Swamp
Swamp

Windmill
Well
School
Forester's house
Monument
Power station
wooden bridge
metal bridge
standalone tree
Spring
Factory
Building
Railroad station
|
Village |

|
Linear conventional signs are designed to depict extended objects on the ground, for example, iron and car roads, clearings, power lines, streams, borders and others. They occupy an intermediate position between large-scale and off-scale conventional signs. The length of such features is expressed at the scale of the map, while the width on the map is not to scale. Usually it turns out to be greater than the width of the depicted terrain object, and its position corresponds to the longitudinal axis of the symbol. Linear topographic symbols also depict horizontal lines.
Let's draw examples of conventional signs and complete our scheme!
|
Village
|
Windmill Well School Forester's house Monument Power station wooden bridge metal bridge standalone tree Spring Factory Building
|
Highway clearing Trail Line power transmission
River
Ravine
|
Explanatory
conventional signs are used to additionally characterize the local objects shown on the map. For example, the length, width and carrying capacity of the bridge, the width and nature of the road surface, the average thickness and height of trees in the forest, the depth and nature of the ford soil, etc. Various inscriptions and proper names of objects on the maps are also explanatory; each of them is performed in a set font and letters of a certain size.
Let's draw examples of conventional signs and complete our scheme!
|
Village
|
Windmill Well School Forester's house Monument Power station wooden bridge metal bridge standalone tree Spring Factory Building
|
Highway clearing Trail Line power transmission
River
Ravine
|

|


Let's take a closer look given type conventional signs.

If you want to get acquainted with other conventional signs, you can download the following document (Word file)
http://irsl.narod.ru/books/UZTKweb/UZTK.html
Now let's put the theoretical knowledge into practice.
You must complete the following five tasks.
Exercise 1.
The site plan is used for:
A) the study of a vast territory, for example, Russia;
B) construction, agricultural work in a small area;
B) traveling around various countries peace;
D) for planning a route if you want to go hiking.
Task 2.
The "ABC of the plan" are conventional signs. But what do they correspond to on the ground? Choose the number under which the conventional sign is shown, corresponding to the letter denoting its meaning (Fig. 7).
For example: 1-A; 2- V.
A) a break B) swamp; B) a path D) shrub; D) meadow

Rice. 7. Conventional signs of the terrain plan
(Baranchikov, Kozarenko, 2007)
Task 3.
Roads are marked on the plan:
A) black solid or dashed lines;
B) brown lines;
B) blue lines
D) green lines.
Task 4.
Scale or areal symbols on the plans of the area indicate the following objects:
A) swamp, orchard, forest, arable land;
B) a well, a school, a spring, a separate tree;
C) path, clearing, river, ravine;
D) railway, vegetable garden, factory, lake.
Task 5.
Carefully study the photograph (Fig. 8) and the plan adjacent to it (Fig. 9).
Answer the questions.


Question 1. Schoolchildren-tourists ford the river near the place where the stream flows into it?
A) YES; B) NO.
Question 2. Is it possible to determine from the plan in which direction the Sona River flows?
A) YES; B) NO.
Question 3. Is it possible to determine from a photograph what is the probable immediate goal of schoolchildren-tourists?
A) YES; B) NO.
Question 4. Is it possible to determine from the plan of the area that tourists are heading towards the village of Sonino, where they can rest and replenish their food supplies?
A) YES; B) NO.
Question 5. What land is occupied most area shown on the plan.
A) swamps
B) mixed forest;
B) shrub
List of literature used by the teacher when developing the lesson
Geography of the Earth: 6th grade: assignments and exercises: a guide for students / E.V. Baranchikov, A. E. Kozarenko, O. A. Petrusyuk, M. S. Smirnova. - M .: Education, 2007. - S. 7-11.
Elementary course in geography: textbook for grade 6. educational institutions / T. P. Gerasimova, N. P. Neklyukova. - M .: Bustard, 2010. - 174 p.
Working programs in geography. Grades 6-9 / N. V. Bolotnikova. - 2nd ed., Rev., add. - M .: Publishing house "Globus", 2009. - S. 5-13.
This material was prepared for you by the geography teacher of the Central Organ No. 109
Daria Nikolaevna Chekushkina.
E-mail address:chekushkina.
daria@
gmail.
com


Conventional signs of topographic maps and plans.
Map frames and coordinate lines. Sheets of topographic maps have three frames: inner, minute and outer. The inner frame is formed by segments of parallels that limit the area of the map from the north and south, and segments of meridians that limit it from the west and east. The values of latitudes and longitudes on the lines of the inner frame are associated with the nomenclature of the map and are written in each of its corners.
A minute frame is placed between the inner and outer frames, on which the divisions corresponding to one minute of latitude (left and right) and longitude (top and bottom) are applied. Dots on the frame mark tens of seconds.
The system of rectangular coordinates on the map is represented by a kilometer grid formed by coordinate lines drawn through 1 km x And y. Values x And y, expressed in kilometers, are inscribed at the exits of the lines outside the inner frame of the map.
Plans of scales 1:5000-1:500 with rectangular layout have only a grid of rectangular coordinates. Its lines are drawn through 10 cm.
Conditional signs. On plans and maps, objects of the area are depicted by conventional signs.
Conventional signs distinguish contour, off-scale and linear.
Contour conventional signs depict objects whose shape and size can be conveyed on the scale of a plan (map). These include land (forests, gardens, arable land, meadows), water bodies, and for larger scales - buildings, structures. The outlines of objects (contours) on the plan are shown by dotted lines or lines of a certain thickness and color. Signs indicating the nature of the object are placed inside the contour.
Off-scale conventional signs depict objects that need to be plotted on the plan, but cannot be depicted on a scale (gas stations, wells, geodetic network points, etc.).
Linear conventional signs depict objects whose length is expressed on the scale of the plan, but the width is not expressed (power lines and communications, pipelines, fences, trails).
To reflect the characteristics of the depicted objects, many conventional signs are accompanied by explanatory captions. So, when pictured railway indicate the height of the embankment and the depth of the excavation, the gauge on the narrow gauge road. When depicting a highway, its width and pavement material are indicated; when depicting communication lines - the number of wires and their purpose; when depicting forests - a tree species, average height, thickness of trunks and distance between trees.
Relief image. On maps and plans, the relief is depicted with the help of contour lines, elevation marks and conventional signs.
Contours- lines of section of the earth's surface by equally spaced level surfaces. In other words, horizontal lines are lines of equal height. Horizontals, like other points of the terrain, are projected onto a level surface. Q and applied to the plan (Fig. 4.3).
Rice. 4.3. Contours: h is the height of the relief section; d- laying
Difference h the heights of adjacent contours, equal to the distance between the secant surfaces, is called relief section height. The value of the section height is signed at the bottom frame of the plan.
The horizontal distance between adjacent horizontals is called laying. The minimum in this place is the laying, perpendicular to the horizontals, - initiation of a ramp. The lower the slope, the steeper the slope.
The direction of the ramp is indicated berghashes- short strokes at some horizontal lines, directed towards the descent. On separate horizontal lines in their breaks, their height is written so that the top of the numbers points in the direction of the rise.
Contours with round heights are made thickened, and to reflect the details of the relief, they use semi-horizontals- dashed lines corresponding to half the height of the relief section, as well as auxiliary horizontals with short strokes, drawn at an arbitrary height.
The image of the relief with contour lines is supplemented by inscribing elevation marks on the plan near the characteristic points of the relief and special conventional signs depicting cliffs, rocks, ravines, etc.
The main landforms are mountains, hollows, ridges, hollows and saddles (Fig. 4.4).

Rice. 4.4. Main landforms: but- mountain; b- basin; in- ridge; G- hollow; d- saddle; 1 - watershed line; 2 - spillway line.
Mountain(hill, hill, barrow, hill) is depicted as closed horizontal lines with berghashes facing outward (Fig. 4.4, but). The characteristic points of the mountain are its top and points at the sole.
Basin(trough) is also depicted as closed horizontal lines, but with berghashes facing inward (Fig. 4.4, b). The characteristic points of the basin are the points on its bottom and along the crest.
Ridge- elongated elevation. It is depicted as enveloping the ridge crest and elongated horizontal lines running along its slopes (Fig. 4.4, in). Bergstrokes, like those of the mountain, are turned outward. The characteristic line of the ridge is the line that runs along its crest. dividing line.
dell(valley, gorge, ravine, beam) - a recess elongated in one direction. It is depicted as elongated, horizontal lines with bergshrikhs facing inward (Fig. 4.4, G). The characteristic line of the hollow is spillway line(thalweg) - the line along which water runs off.
Saddle(pass) - a decrease between two hills (Fig. 4.4, d). Hollows adjoin the saddle on both sides. A saddle is the intersection of a watershed and a spillway.
Latest materials
Main regularities of static deformation of soils
Over the past 15...20 years, as a result of numerous experimental studies With the use of the test schemes discussed above, extensive data on the behavior of soils under a complex stress state were obtained. Because currently in…
Elastic-plastic deformation of the medium and loading surface
Deformations of elastoplastic materials, including soils, consist of elastic (reversible) and residual (plastic) ones. To compile the most general ideas about the behavior of soils under arbitrary loading, it is necessary to study separately the patterns ...
Description of schemes and results of soil tests using stress and strain state invariants
In the study of soils, as well as structural materials, in the theory of plasticity it is customary to distinguish between loading and unloading. Loading is a process in which an increase in plastic (residual) deformations occurs, and a process accompanied by a change (decrease) ...
Invariants of the stressed and deformed states of the soil medium
The use of stress and strain invariants in soil mechanics began with the emergence and development of soil research in devices that allow for two- and three-axis deformation of samples under conditions of a complex stress state ...
On stability coefficients and comparison with experimental results
Since in all the problems considered in this chapter, the soil is considered to be in the ultimate stressed state, then all the calculation results correspond to the case when the stability factor k3 = 1. For ...
Ground pressure on structures
The methods of the theory of limit equilibrium are especially effective in the problems of determining the pressure of soil on structures, in particular, retaining walls. In this case, a given load on the soil surface is usually taken, for example, normal pressure p(x), and...
Bearing capacity of foundations
The most typical problem of the limiting equilibrium of the soil medium is to determine the bearing capacity of the foundation under the action of normal or inclined loads. For example, in the case of vertical loads on the base, the task is reduced to…
The process of detachment of structures from the foundations
The task of evaluating the conditions of separation and determining the force required for this arises when lifting vessels, calculating the holding force of “dead” anchors, removing offshore gravity drilling supports from the ground during their rearrangement, and ...
Solutions of Plane and Spatial Consolidation Problems and Their Applications
There are a very limited number of solutions for flat and, even more so, spatial problems of consolidation in the form of simple dependencies, tables or graphs. There are solutions for the case of applying a concentrated force to the surface of a two-phase soil (B…
More materials
Some physical foundations
The study of the relationship between mechanical, including elastic properties of solids, their structure and composition is one of the most important areas of physics solid body. In the last 10-15 years, theoretical and experimental...
Truss monosupport drilling foundations can be piled and non-piled. The latter are more convenient for installation and transportation from one drilling point to another. Drilling rigs mounted on the basis of truss monosupport bases…
Physical and chemical aspects
Introduction For a long time, the experience and ideas of laboratory modeling of the seismic process have been widely used in setting up real monitoring and analyzing its data. However, this experience did not bring us closer to solving the practical problem of accurate ...
Problems of laboratory modeling
Process modeling in earth's crust in connection with earthquakes has always been associated with significant difficulties. However, the similarity of destruction in the earth's crust and a monolithic laboratory sample was admitted almost without discussion that ...
Non-sloping cable-stayed systems of arbitrary form
The rod of an arbitrary hinged-rod Byte system in the position of stable equilibrium is given by a vector in the Cartesian coordinate system. In the deformed state, the rod is represented by a vector. ia and u, are the displacement vectors of the end nodes ...
Development and consolidation of a spatial cryogenic crystallization structure
The development and consolidation of a spatial cryogenic crystallization structure due to the freezing of the liquid phase and the metamorphism of ice crystals can proceed both at a constant temperature due to aftereffect phenomena, and with a decrease in temperature ...